By Amanda Margozzi
The Hoffman Agency, San Jose
As a public relations practitioner for high-tech B2B companies, I am no stranger to the task of taking dry marketing jargon — or as we call it, corporate speak — and transforming it into an intriguing, human story that might actually interest journalists.
Throw in the challenge of making the story compelling visually, and it’s time to get the creative juices flowing. Here are three ways businesses are successfully applying visuals to storytelling in unconventional ways:
Infuse humor
While a picture may be worth 1,000 words, a humorous picture is worth 1,000 retweets.
As demonstrated by Starbucks’ Twitter account dedicated exclusively to the infamous Pumpkin Spice Latte, @TheRealPSL hasn’t accumulated 121,000+ followers simply by posting pictures of coffee in a paper cup.
The sunglass-wearing, yoga-doing, popcorn-eating PSL is personified as quite the jokester, proving that combining unexpected visuals with clever captions is the perfect recipe for increasing engagement.

Keep it subtle
For a service-based company, building a strong visual representation of the brand in a non-product-centric way can be quite the challenge.
The American Express Facebook account, however, has taken the creative route by only subtly including its credit card in environmental photographs with related items. The following image, for example, sets the scene of a winter day in which the snow is perhaps falling so hard that you need to order take-out for dinner, using your American Express card.
In addition, depicting timely trends, such as holidays and seasons, is a great way to show versus tell your customer how they could use your product or service.

Lighten up your heavy data
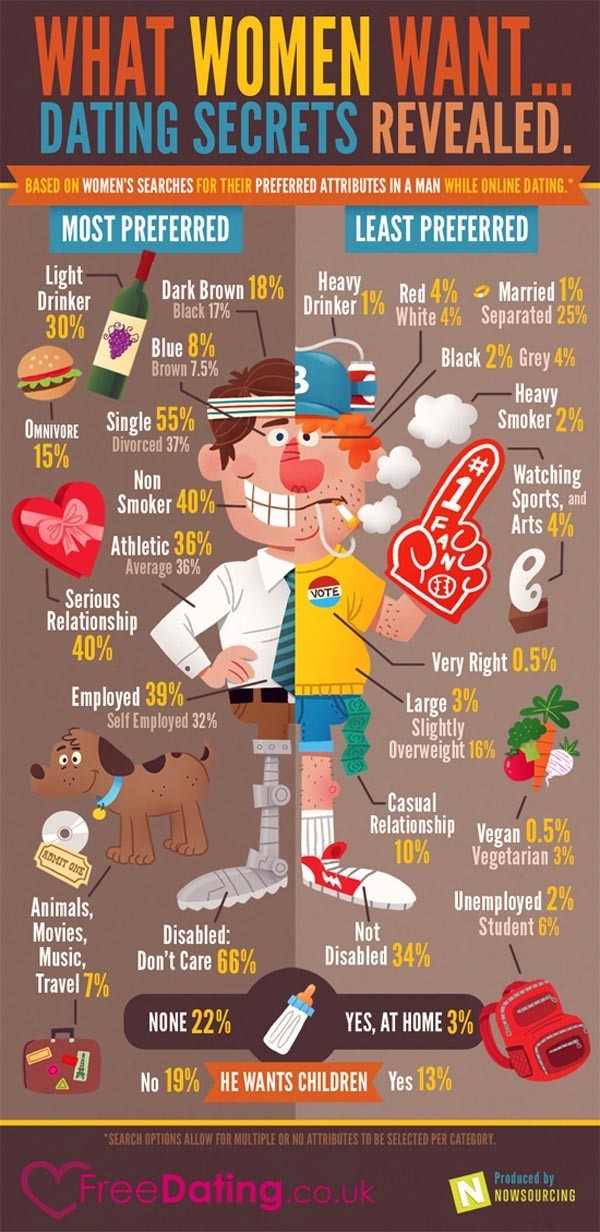
Converting large amounts of data into an infographic is often the most effective way to make survey results or statistics more digestible for the reader. They’re also a great way to bring a pop of color to a text-heavy blog or social media post.
Take this infographic from FreeDating.co.uk, for instance. Rather than simply listing percentages, the online dating site portrayed their data of which attributes women prefer most and least in a man in a witty, light-hearted visual, complete with colorful and cartoonish illustrations.
While inserting a joke or creating a cartoon infographic may not always be the appropriate route to take with your client’s story, taking a risk with an out-of-the-ordinary visual is a sure way to stand out from the corporate crowd.